

1. Design Concept of the Circular Walkway
1.1 Site Analysis of Ngong Ping Village
1.2 Terrain-Based Circular Alignment Strategy
2. Spatial and Experiential Design of the Circular Walkway
3. Structural Engineering Challenges
3.1 Optimization of Vertical Alignment for the Treetop Walkway
3.2 Structural Design of the Curved Bridge
4. Result of Structural Analysis
4.1 Effect of Section Optimization and Initial Forces
4.2 Serviceability Verification
4.3 Ultimate Limit State Evaluation
5. Conclusion
1. Design Concept of the Circular Walkway
1.1 Site Analysis of Ngong Ping Village
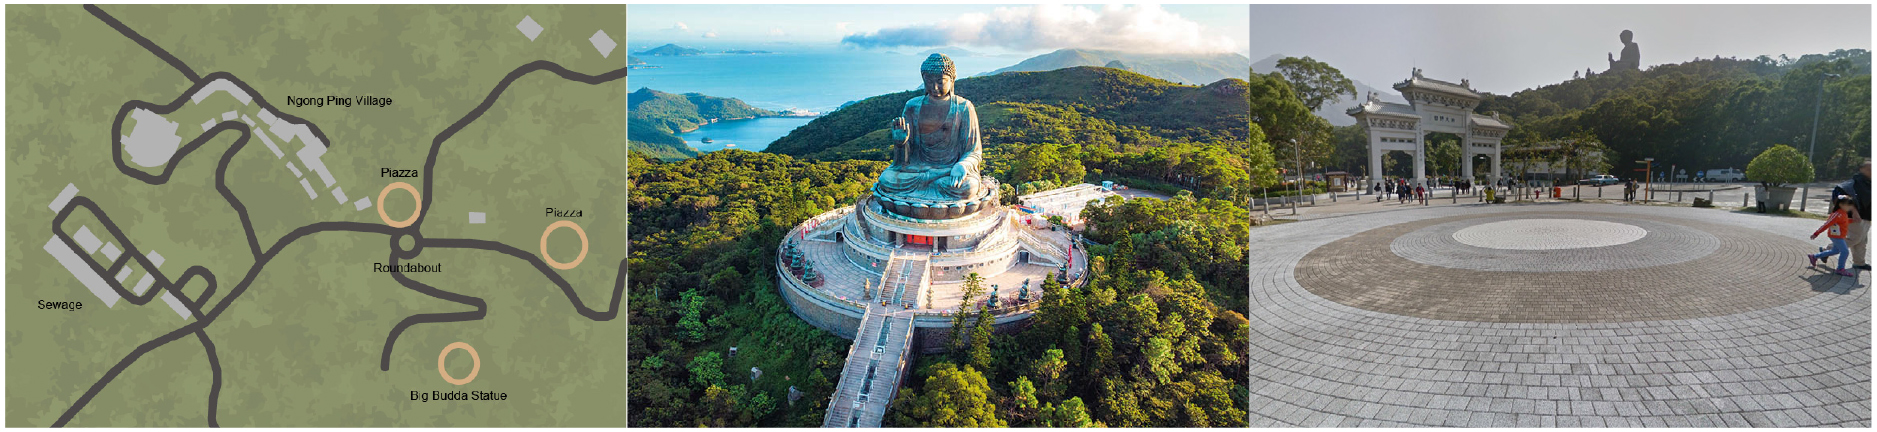
Ngong Ping Village on Lantau Island in Hong Kong is characterized by its cultural landscape surrounding the Big Buddha statue and the mountainous terrain. Site analysis revealed recurring circular spatial elements, including the large circular podium of the Big Buddha and the two nearby circular plazas, reflecting Buddhist symbolism such as the “wheel of life.” Based on this interpretation, the present study adopts circular geometry as the central design principle.
1.2 Terrain-Based Circular Alignment Strategy
The circular design concept is operationalized in this study through a terrain-based alignment strategy. To determine the precise placement of the circular walkway, a geometric approach was employed in conjunction with topographic analysis.
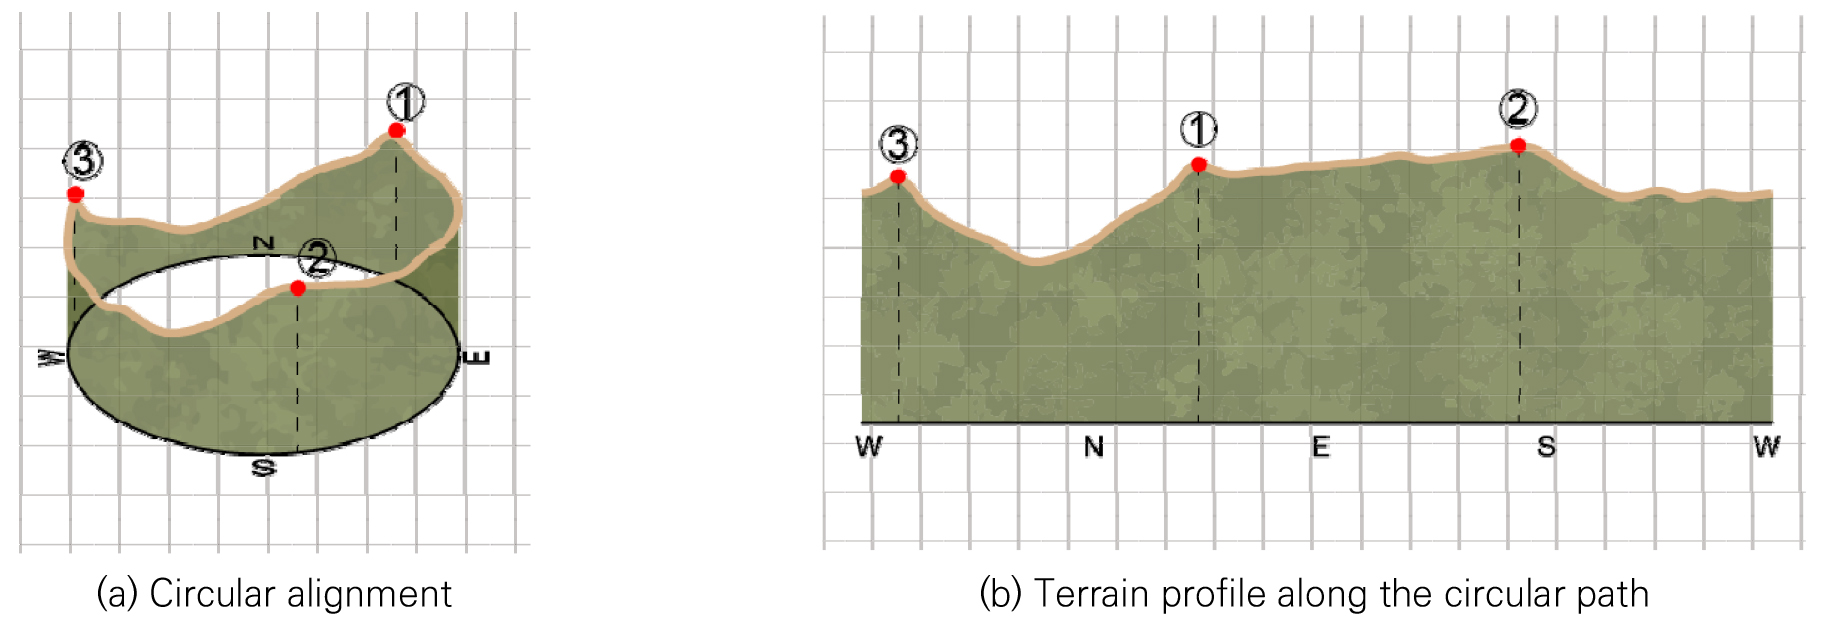
Based on the geometric principle that a unique circle is defined by three non-collinear points, three viewpoint locations were first identified across the site to serve as key scenic nodes along the route (Fig. 2). These locations were selected based on their suitability as scenic vantage points corresponding to local terrain peaks. The selected viewpoints were arranged to be approximately uniformly distributed, and were then used to define the circular alignment of the walkway. While the resulting alignment forms a circular geometry in plan view, the vertical profile of the walkway follows the existing ground surface, enabling continuous variation in elevation along the circular path.
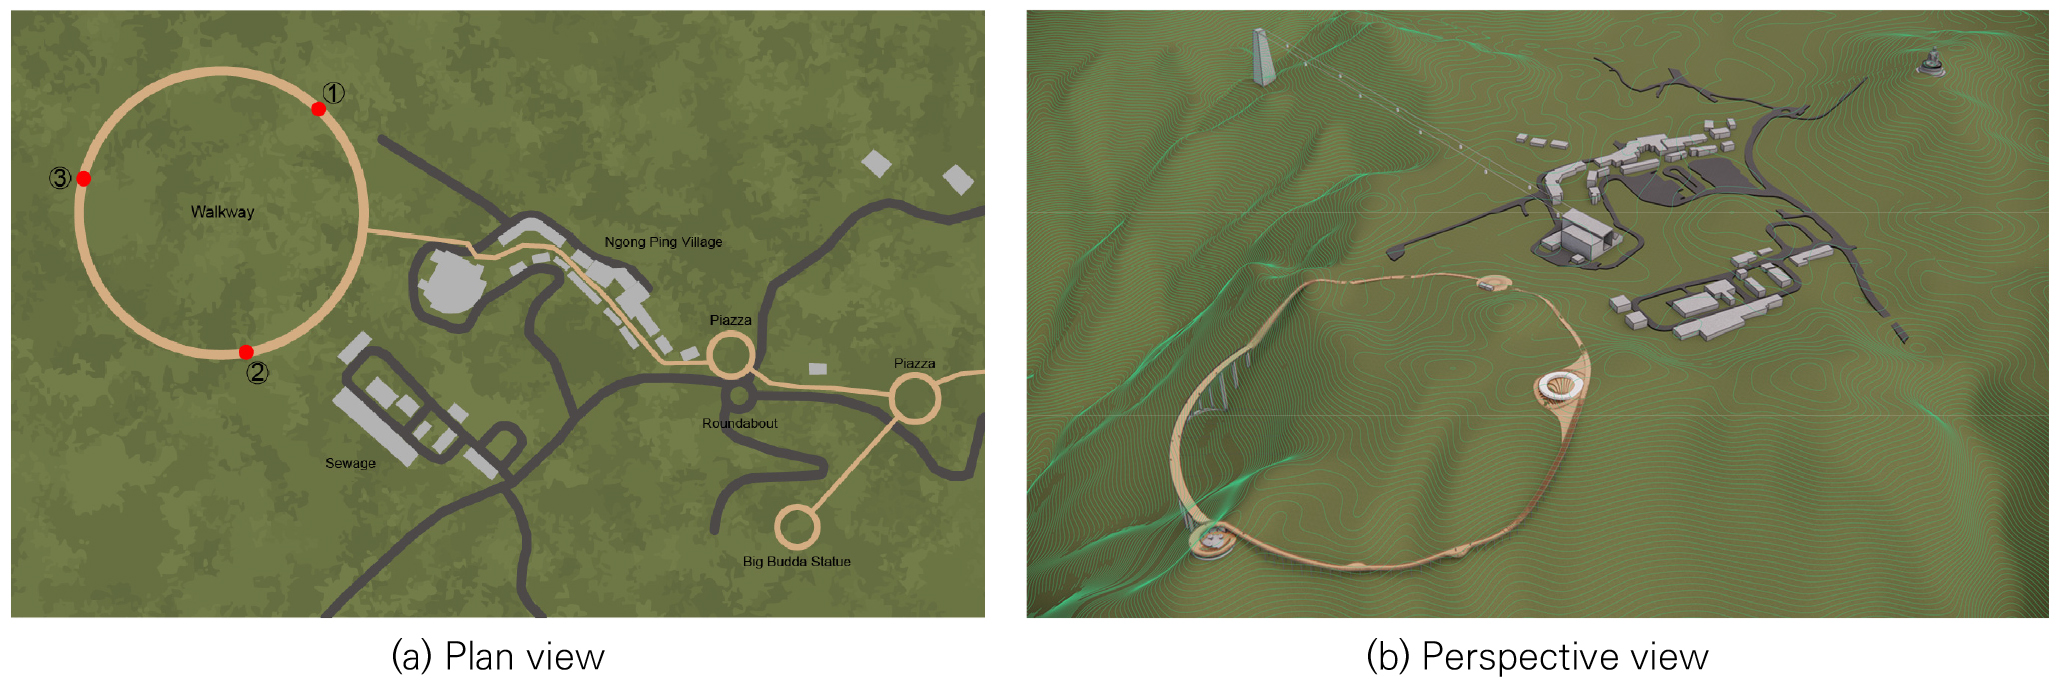
By defining these peak points as Point ①, Point ②, and Point ③, the circular alignment is subdivided into three segments: Segment 1 connecting Point ① to Point ②, Segment 2 connecting Point ② to Point ③, and Segment 3 connecting Point ③ back to Point ①. This segmentation provides the structural and spatial basis for the distinct walking experiences along the route. An overview of the proposed circular walkway and its integration within the site context is shown in Fig. 3.
2. Spatial and Experiential Design of the Circular Walkway
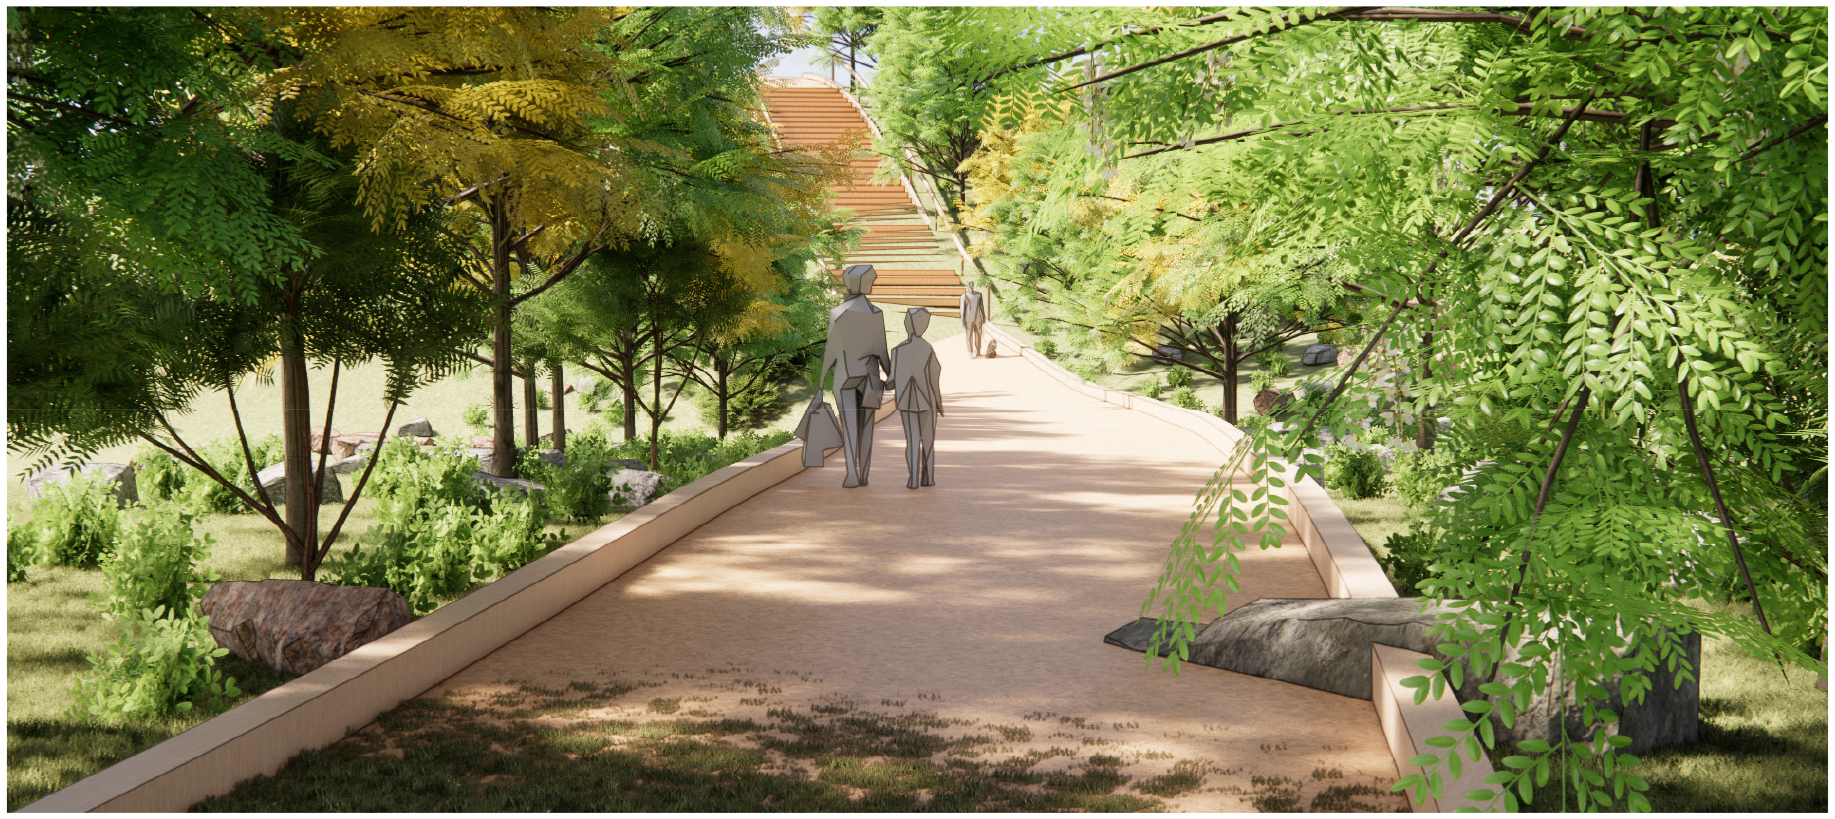
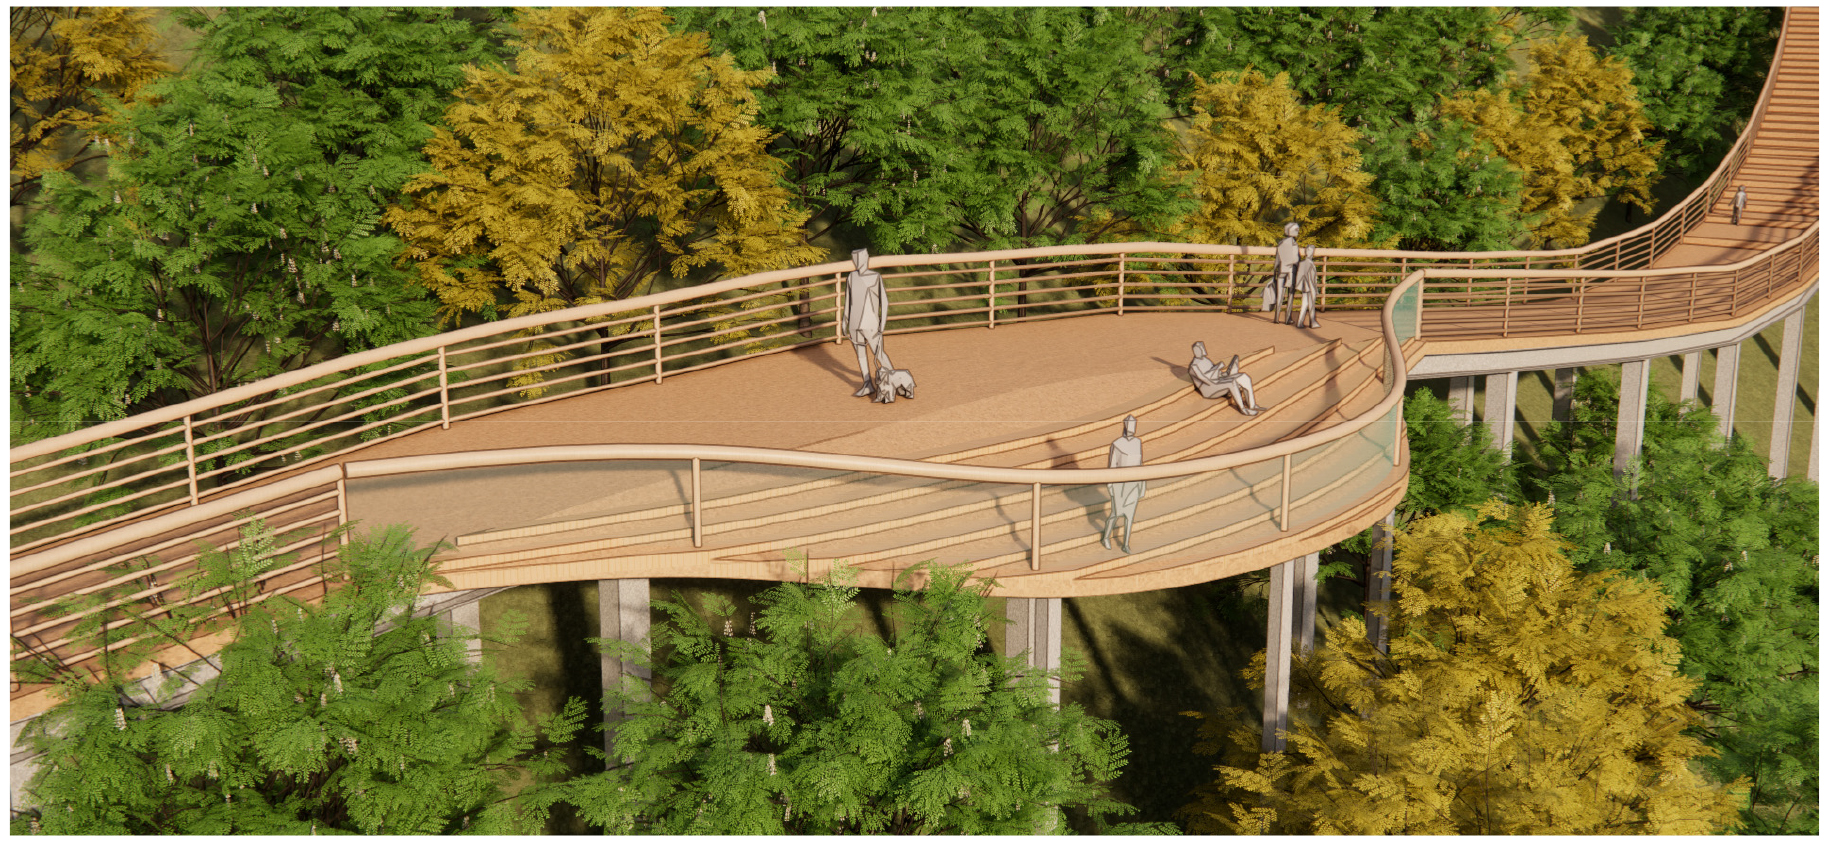
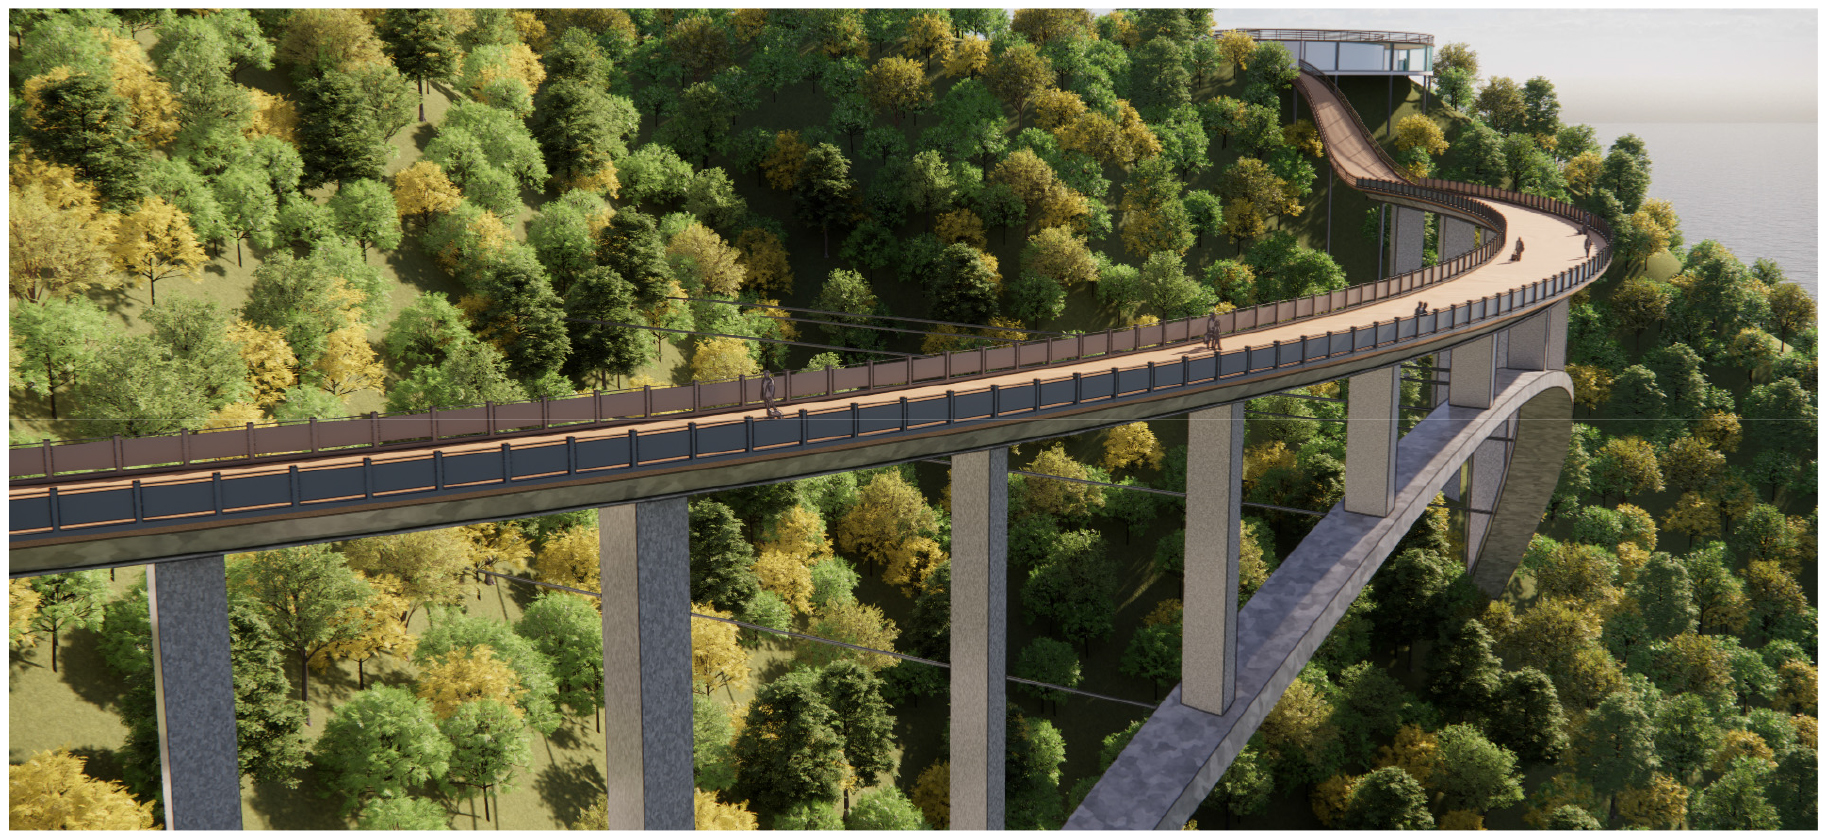
The circular alignment defined by Point ①, Point ②, and Point ③ results in three distinct segments, each shaped by its relationship to the surrounding terrain and vegetation. Segment 1 (Point ① − Point ②) corresponds to the forest walkway, maintaining a relatively uniform elevation aligned with the lower canopy and providing a stable, gentle walking environment, as shown in Fig. 4. Segment 2 (Point ② − Point ③) transitions into a treetop walkway where pronounced terrain variations necessitate elevating the deck to achieve a consistent gradient, enabling users to experience views above the tree canopy, as depicted in Fig. 5. Segment 3 (Point ③ − Point ①) comprises a curved bridge supported by a spatial arch, forming the most architecturally expressive portion of the walkway and offering expansive panoramic views, as illustrated in Fig. 6.
3. Structural Engineering Challenges
3.1 Optimization of Vertical Alignment for the Treetop Walkway
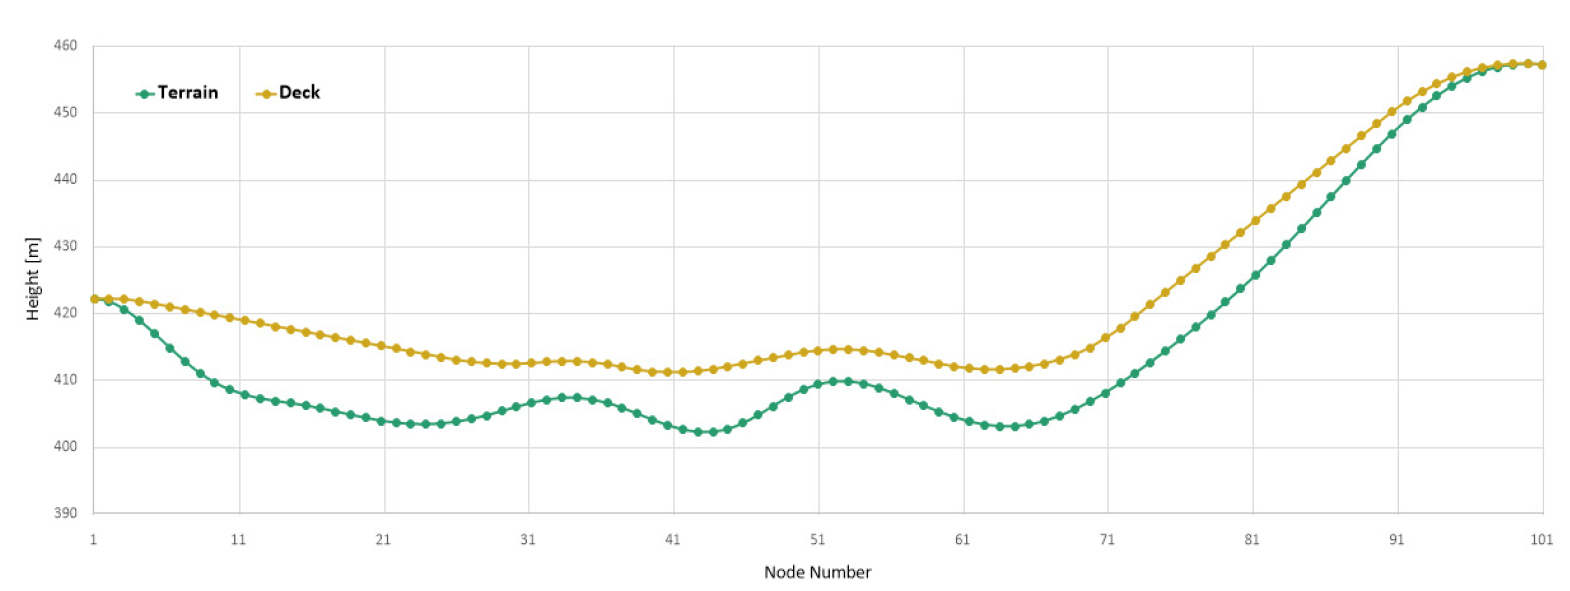
The proposed circular walkway traverses steep and varying terrain, necessitating a systematic approach to slope optimization to ensure user comfort, structural feasibility, and visual continuity. To address this, an elevation dataset was first generated along the circular alignment using topographic information. The initial ground profile was translated into a parametric dataset, from which an optimized vertical alignment was derived to maintain a desirable walking gradient while minimizing abrupt elevation transitions. This process was conducted using spreadsheet-based computation to identify feasible slope configurations. The optimized deck elevation (yellow line) was then compared with the existing terrain profile (green line), as shown in Fig. 7.
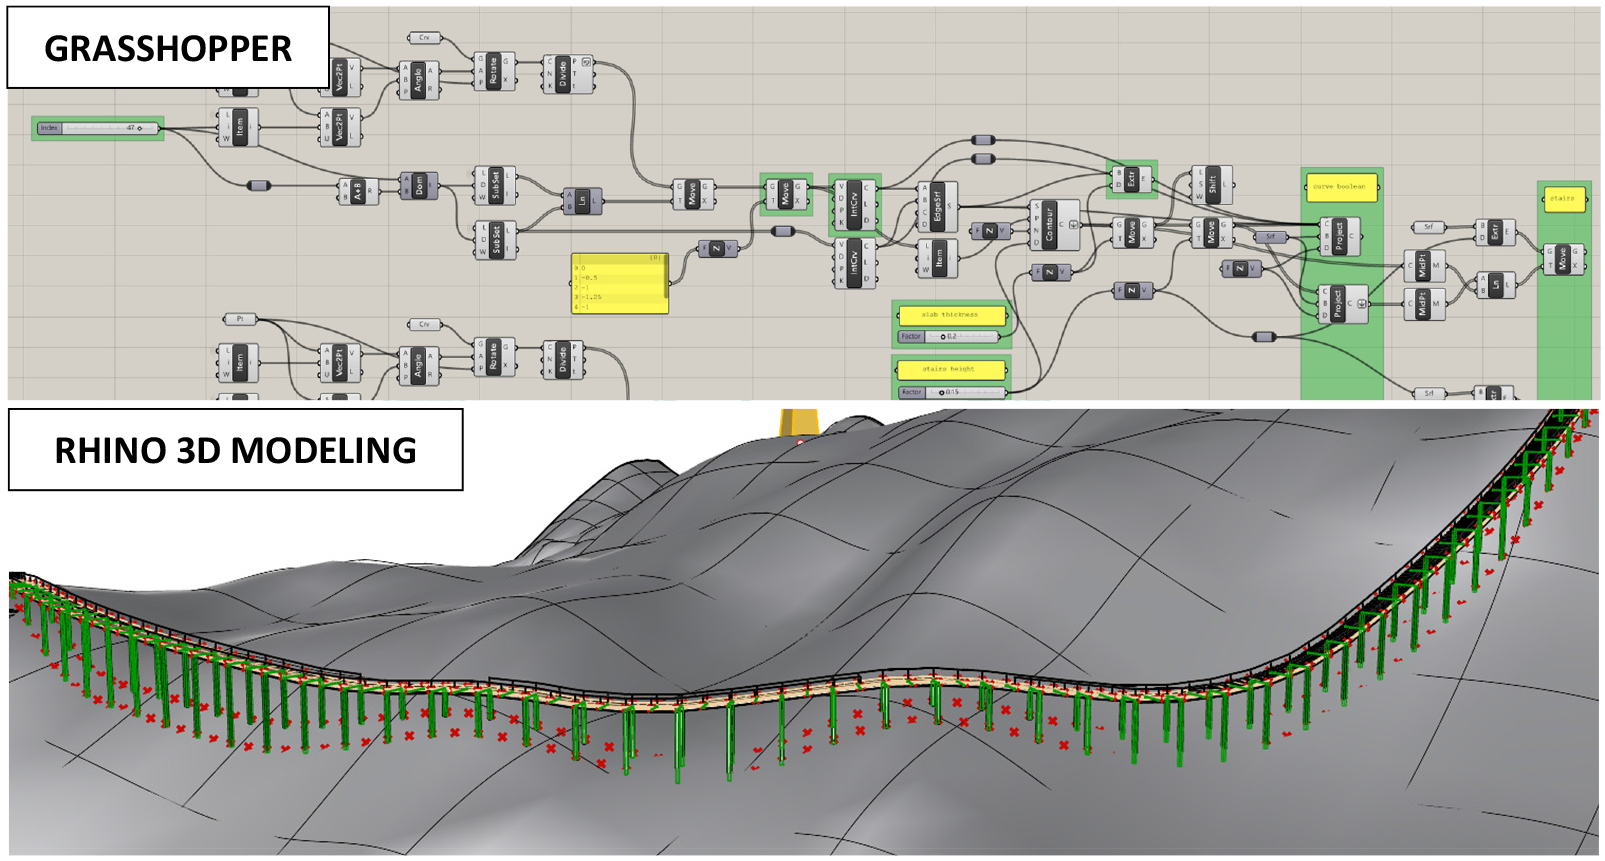
A parametric modelling system was developed in Grasshopper by importing the optimized slope data, as shown in Fig. 8. The system enabled instantaneous updates of the walkway geometry in response to changes in slope or alignment parameters. The geometry was linked to Rhino 3D for real-time visualization and design coordination.
3.2 Structural Design of the Curved Bridge
The principal design requirements and key geometric parameters in this study are summarized in Table 1.
Table 1.
Design requirements and geometric parameters
| Category | Design Requirement |
| Total Length | 222 m |
| Pedestrian Live Load | 5.0 kPa |
| Maximum Peak Wind Velocity | 80 m/s |
| Ground condition | Competent rock between 0–3 m |
In selecting the bridge type, an arch-type bridge was adopted to avoid introducing visually dominant structural elements into the site . Because the bridge must follow the circular alignment of the walkway, a spatially curved arch was required to support the curved girder, which introduced significant torsional effects under self-weight. Accordingly, a dedicated structural system was developed to provide adequate torsional resistance and ensure the stability of the spatial arch bridge.
3.2.1 Structural System Development
The structural system for the curved bridge integrates a spatial arch with horizontal cables. The load-resisting mechanism of the structural system is illustrated in Fig. 9. Let Cxyz denote the resultant compressive force acting in the spatial arch rib. This force can be decomposed into a vertical-plane component Cxz, acting in the x–z plane, and a transverse-plane component Cxy, acting in the x–y plane. Vertical force equilibrium is achieved between the external vertical loads and Cxz, while transverse force equilibrium is satisfied between the external transverse loads, the horizontal cable tension Ty, and the transverse component Cxy of the arch compression force.
3.2.2 Details of Spatial Arch Bridge
As shown in Fig. 10, the spatial arch bridge has a clear span of 144 m and an arch rise of 35 m. Vertical piers supporting the deck are arranged at a spacing of 16 m along the span. The arch follows a horizontal curvature with a radius of 157 m and a central angle of 56.2°. The SM490 steel with yield stress 295 MPa, as specified in the Road Bridge Design Code (2016), was used for both the arch rib and girder elements.
3.2.3 Optimization of Arch Sectional Properties
To determine the sectional properties of the tapered arch members, a finite element analysis was performed using MIDAS CIVIL under the factored load combination corresponding to Ultimate Limit State 4 (1.5DL), following the Road Bridge Design Code (2016). Force diagrams for axial force Fx, major-axis bending moment My were extracted from the analysis results. Envelopes of these diagrams were generated to simplify the required capacity evaluation along the arch span. After that, MATLAB-based optimization procedure was developed to compute optimal sectional properties. The overall workflow of the sectional optimization procedure is summarized in Fig. 11. The process first estimated the required cross-sectional area based on axial force demands, followed by determining suitable second moments of inertia Iy and Iz reflecting the ratio of bending moment demands. The proposed sections were then verified against combined force criteria and local buckling requirements in accordance with ANSI/AISC 360-16 (AISC, 2016). Through this process, the optimized tapered sectional dimensions—width, height, and thickness—were obtained.
3.2.4 Calculation of Arch Prestress and Cable Pretension
Arch prestress levels and cable pretension forces were evaluated to enhance structural performance and reduce service-level stresses in the spatial arch bridge. The arch prestress was determined using a nonlinear shape-finding analysis, following the equilibrium-based formulation introduced by Kim et al. (2002). This procedure establishes the required initial axial compression by satisfying force equilibrium in the vertical plane for the curved arch geometry. Cable pretension forces were subsequently computed by enforcing transverse-plane equilibrium between the arch rib and the horizontal cables, ensuring that the transverse component of the arch compression is balanced by the cable tension. The overall force-balancing mechanism used in the shape-finding process—based on nodal equilibrium in both the vertical and transverse planes—is illustrated in Fig. 12.
The resulting pre-compression force of the arch in the x-direction was Cx = 18,680 kN, while the i-th cable pretension force Ti ranged from 2,046 kN to 2,370 kN, as summarized in Table 2.
4. Result of Structural Analysis
4.1 Effect of Section Optimization and Initial Forces
To examine the impact of optimized arch tapered sections and prestress forces, the analysis results under the ULS4 load combination (1.5DL) were compared against the case with uniform sections and no prestress forces. In the unoptimized condition, member stresses ranged from 31.54 MPa to 134.8 MPa. After applying the optimized tapered sections together with the arch prestress and cable pretension, the stress range was significantly reduced to 26.86 MPa to 60.22 MPa, demonstrating a substantial improvement in stress uniformity and overall structural efficiency.
4.2 Serviceability Verification
Serviceability was evaluated based on the deflection criteria in the Road Bridge Design Code (MLTM, 2010), which specifies an allowable sag of L/600 for general steel bridges. For a span length of 154 m, the allowable deflection is 257 mm. Under the 1.5DL load case, the maximum vertical deflection of the curved bridge was 27.2 mm, which is well within the serviceability limit (27.2 mm < 257 mm), confirming satisfactory deformation performance.
4.3 Ultimate Limit State Evaluation
Ultimate limit state checks were performed using the LRFD method in accordance with the Road Bridge Design Code (MOLIT, 2016). The combined permanent loads arising from the steel superstructure and deck system is significantly larger than the magnitude of the pedestrian live load (5.0 kPa). In addition, given the site’s maximum peak wind speed of 80 m/s, wind-induced actions were expected to govern the structural response under extreme conditions. Accrodingly, two governing limit states were considered: ULS3 (wind-dominant condition) and ULS4 (dead-load dominant condition).
ULS3, corresponding to wind-dominant conditions, was assessed because the site’s maximum peak wind speed of 80 m/s exceeds the 25 m/s threshold at girder height. Using the load combination 1.25DL + 1.25PS + 1.4WS, the maximum cable stress was 110.8 MPa < 0.95fy = 280.25 MPa, and the maximum beam stress was 50.7 MPa < 0.90fy = 265.5 MPa. Both values satisfy the ULS3 strength limits.
ULS4, applicable when dead load governs, was evaluated under the load combination 1.5DL + 1.5PS. The maximum cable stress was 125 MPa < 0.95fy = 280.25 MPa, and the maximum beam stress was 60.2 MPa < 0.90fy = 265.5 MPa. Thus, the structural components satisfy the strength requirements for ULS4 as well.
5. Conclusion
This study presented the conceptual and structural design of a circular elevated walkway in Ngong Ping Village, integrating Buddhist symbolism, landscape sensitivity, and engineering rationality. A terrain-based circular alignment strategy and segment-specific spatial planning established a coherent experiential framework, while the curved bridge supported by a spatial arch embodied both aesthetic restraint and structural innovation. Through sectional optimization, prestress and pretension calculations, and comprehensive serviceability and ultimate limit state evaluations, the proposed system was shown to achieve stable and feasible performance under governing load conditions. The design successfully fulfills the objectives of harmonizing with nature, enhancing visitor experience, expressing cultural meaning, and maintaining structural safety. The methodologies and findings of this work provide a meaningful reference for future designs of landscape walkways and tourism-oriented infrastructure in similarly challenging terrains.
